The Academic IELTS Writing Task 1 requires you to use several vocabularies to present the data given in a pie/ bar/ line/ mixed graphs or to describe a process or a flow chart. Being able to use appropriate vocabulary, presenting main trends, comparing & contrasting data and presenting the logical flow of the graph ensures a high band score in your Academic IELTS writing task 1. This vocabulary section aims to help you to learn all the vocabulary, phrases and words you need to know and use in your Academic writing task 1 to achieve a high band score. The examiner will use four criteria to score your response: task achievement, coherence and cohesion, lexical resource, grammatical range and accuracy. Since lexical resources will determine 25% of your score in Task 1, you have to enrich your vocabulary to hit a high score. To demonstrate that you have a great lexical resources you need to:
- Use correct synonyms in your writing.
- Use a range of vocabulary.
- Do not repeat words and phrases from the exam questoin unless there is no alternative.
- Use less common vocabulary.
- Do not use the same word more than once/twice.
- Use precise and accurate words in a sentence.
It is advisable that you should learn synonyms and use them accurately in your writing in order to give an impression that you have a good range of vocabulary.
The general format for writing academic writing task 1 is as following:
Introduction + Basic/ General Trends + Details Description + Conclusion.
Each part has a specific format and therefore being equipped with the necessary vocabulary will help you to write the task 1 efficiently and will save a great deal of time.
Starting
|
Presentation Type
|
Verb
|
Description
|
The given / the supplied / the presented / the shown / the provided
|
diagram / table / figure / illustration / graph / chart / flow chart / picture/ presentation/ pie chart / bar graph/ line graph / table data/ data / information / pictorial/ process diagram/ map/ pie chart and table/ bar graph and pie chart ...
|
shows / represents / depicts / illustrates / presents/ gives / provides / describes / compares/ shows contrast / indicates / figures / gives data on / gives information on/ presents information about/ shows data about/ demonstrate/ outlines/ summarise...
|
the comparison of ….
the differences …. the number of …. information on …. data on …. the proportion of…. the amount of …. information on.... data about... |
Example :
- The provided diagram shows data on employment categories in energy producing sectors in Europe starting from 1925 and till 1985.
- The given pie charts represent the proportion of male and female employee in 6 broad categories, divided into manual and non-manual occupations in Freedonia.
- The chart gives information on expenditures of 4 European countries on six consumer products namely Germany, Italy, Britain and France.
- The supplied bar graph compares the number of male and female graduated in three developing countries while the table data presents the overall literacy rate in these countries.
- The bar graph and the table data depicts the water use in different sectors in five regions.
Tips:
1. For a single graph use 's' after the verb, like - gives data on, shows/ presents etc. However, if there are multiple graphs, DO NOT use 's' after the verb.
2. If there are multiple graphs and each one presents different type of data, use can write which graph presents what type of data and use 'while' to show a connection. For example -'The given bar graph shows the amount spent on fast food items in 2009 in the UK while the pie chart presents a comparison of people's ages who spent more on fast food.
3. Your introduction should be quite impressive as it makes the first impression to the examiner. It either makes or breaks your overall score.
Vocabulary for the General trends Part:
In general, In common, As is presented, Generally speaking, As is observed, As a general trend, As can be seen, Generally speaking, Overall.
Example:
- In general the employment opportunity has increased till 1970 and has dropped down afterward.
- As is observed, the figures for imprisonment in the five mentioned countries show no overall pattern of increase or decrease rather shows the considerable fluctuation from country to country.
- Generally speaking, USA had far more standard life than all the other 4 mentioned countries.
- As can be seen, the highest number of passengers used the London Underground station at 8:00 in the morning and at 6:00 in the evening.
- Generally speaking, more men were engaged in managerial positions in 1987 than that of women in New York.
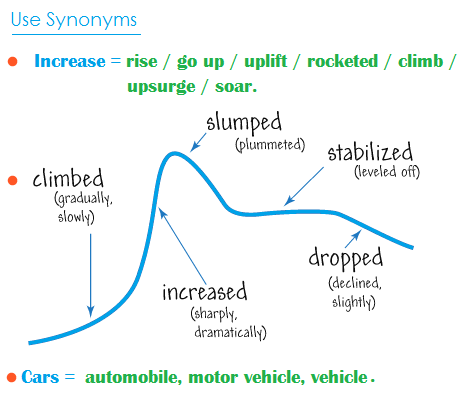
Vocabulary to show the changes:
Trends
|
Verb form
|
Noun Form
|
Increase
|
rise / increase / go up / uplift / rocket(ed) / climb / upsurge / soar.
|
a rise / an increase / an upward trend / a growth
|
Decrease
|
fall / decrease / decline / plummet / plunge / drop / reduce
| a fall / a decrease / a reduction / a downward trends /a downward tendency / a decline/ a drop |
Steadiness
|
unchanged / level out / remain constant / remain steady / plateau / remain the same / remain stable / remain static
|
a steadiness/ a plateau / a stability/ a static
|
Gradual Increase
|
------------
|
an upward trend / an upward tendency / a ceiling trend
|
Gradual decrease
|
------------
|
a downward trend / a downward tendency / a descending trend
|
Standability
|
level(ed) off / remain(ed) constant / remain(ed) unchanged / remain(ed) stable / prevail(ed) consistency / plateaued / reach(ed) a plateau / stay(ed) uniform /immutable / level(ed) out/ stabilise/ remain(ed) the same.
|
--------------
|
Examples:
- The overall sale of the company has increased by 20% at the end of the year.
- The expenditure of the office remained constant for the last 6 months but the profit rose by almost 25%.
- There was a 15% drop in the student enrollment of the University.
- The population of the country remained almost the same as it was 2 years ago.
- The population of these two cities increase significantly in the last two decades and it is predicted that it will remain stable in the next 5 years.
Tips: Use 'improve' /'an improvement' to describe a situation like economic condition or employment status. To denote numbers use other verbs/nouns like increase.
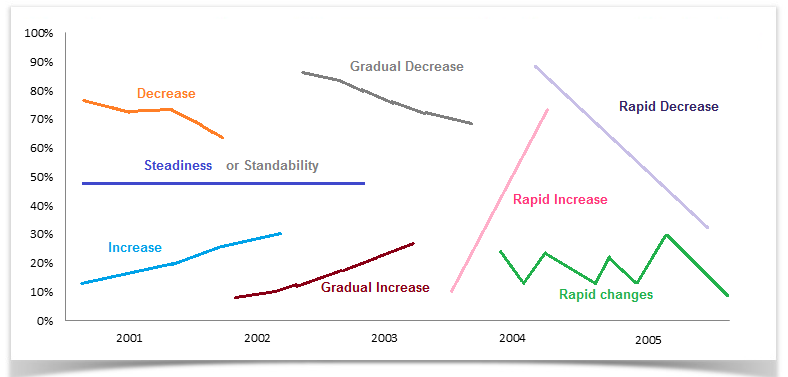
Vocabulary to represent changes in graphs:
Type of Change
|
Adverb form
|
Adjective form
|
Rapid change
|
dramatically / rapidly / sharply / quickly / hurriedly / speedily / swiftly
|
dramatic / rapid / sharp / quick / hurried / speedy / swift
|
Moderate change
|
moderately / gradually / progressively / sequentially
|
moderate / gradual / progressive / sequential
|
Slight change
|
slightly / slowly / mildly / tediously
|
slight / slow / mild / tedious
|
Example:
- The economic inflation of the country increased sharply by 20% in 2008.
- There was a sharp drop in the industrial production in the year 2009.
- The demand for new houses dramatically increased in 2002.
- The population of the country dramatically increased in the last decade.
- The price of the oil moderately increased in last quarter but as a consequence the price of daily necessity rapidly went up.
 Vocabulary to represent frequent changes in graphs:
Type of Change
|
Verb form
|
Noun form
|
Rapid ups and downs
|
wave / fluctuate / oscillate / vacillate / palpitate
|
waves / fluctuations / oscillations / vacillations / palpitations
|
Example:
- The price of the raw materials fluctuated for the first three months.
- The graph shows the oscillations of the price of fuel from 1998 to 2002.
- The passenger number in this station oscillates throughout the day but early morning and evening are the two busiest time.
- The changes of car production in Japan shows a palpitation for the second quarter of the year.
- The number of students in debate clubs fluctuated in different months as a rapid ups and downs could be observed in the last three months.
Task Achievement:
Fully satisfies all the requirements of the task.
Clearly presents a fully developed response.
Fully satisfies all the requirements of the task.
Clearly presents a fully developed response.
Coherence and Cohesion:
Uses cohesion in such a way that it attracts no attention.
Skilfully manages paragraphing.
Uses cohesion in such a way that it attracts no attention.
Skilfully manages paragraphing.
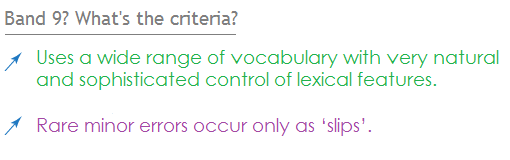
Lexical Resource:
Uses a wide range of vocabulary with very natural and sophisticated control of lexical features.
Rare minor errors occur only as ‘slips’.
Uses a wide range of vocabulary with very natural and sophisticated control of lexical features.
Rare minor errors occur only as ‘slips’.
Grammatical Range and Accuracy:
Uses a wide range of structures with full flexibility and accuracy.
Rare minor errors occur only as ‘slips’.
Uses a wide range of structures with full flexibility and accuracy.
Rare minor errors occur only as ‘slips’.
Comments
Post a Comment